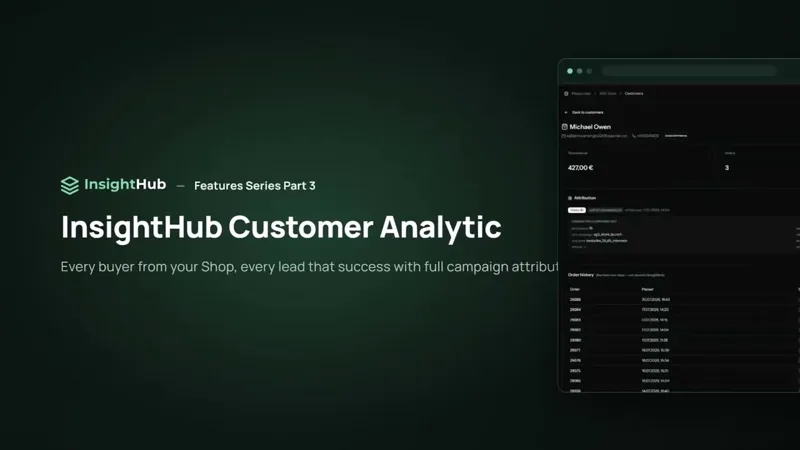
“Which campaign paid off?” is a short question with an awkward answer: the ad platform counts clicks, the shop counts orders, the CRM counts leads — and nobody connects the three. Campaign analytics in InsightHub does exactly that.
Two views: orders and leads
The dashboard has two views — Orders and Leads — with a period switch from the last 24 hours all the way to all time. Each view exports to PDF in one click, for the monthly report for instance.
The Orders view
At the top are the big numbers: visits, customers, revenue and more. Visits from newsletters, social links and ads are attributed to the right campaign automatically via UTM tracking.
Below that:
- Trend: a chart of website traffic over time — with leads plotted on the same line, so you see how visits turn into prospects.
- Sources: visits and customers side by side per source, traffic by medium (social, organic, paid and more) and a table with visits, customers, revenue and average order value per source.
- Campaigns: every campaign behind your traffic, listed by name.
- Top landing pages: the first pages your visitors opened.
The Leads view
The same picture through a different lens: instead of revenue you see how many visits turned into leads, the lead rate — and how many of those leads later became customers or were lost. If you sell services rather than products, this is the view that matters: a campaign with few but won leads beats one with many inquiries that go nowhere.
How to use it
- shift budget to the sources with the highest revenue per visit, not the most clicks
- rework landing pages with plenty of traffic but few leads
- use the PDF export as a fixed monthly report for management or clients
Campaign analytics shows the totals; which campaign brought a single buyer in is on the Customers overview.